How Infographics Benefit Your Content Strategy
Are you taking advantage of infographics as a part of your content strategy? If not, you are missing out on a valuable, highly shareable digital marketing tool.
What is an Infographic?
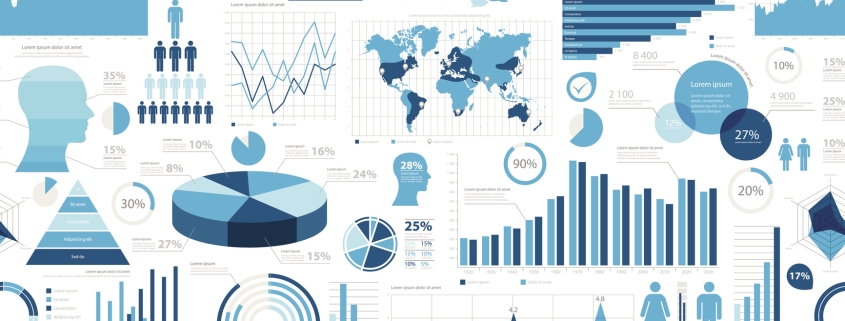
An infographic is a collection of images, or graphics, paired with written copy to provide a visualization of data or information. Infographics summarize data and present information in an engaging, easy-to-understand way. The average consumer is much more likely to quickly peruse an infographic rather than commit time to reading a long article. Infographics offer enhanced readability and a low time commitment, two aspects that are important to consumers.
Quickly Educate & Engage
The mind processes images much faster than words. As a result, the visual nature of infographics helps speed up the rate at which information is processed. Consumers can then process information more quickly and come to a decision faster. Not only that but, as humans, we naturally gravitate toward visual elements. As a result, infographics are extremely effective at grabbing our attention and engaging our interest.
In addition, since infographics breakdown information piece-by-piece, they are great for presenting complex ideas in a digestible way. As a result, infographics will help businesses communicate complicated industry-specific topics in an easy-to-understand and approachable way.
Improve Content Shareability
Infographics are also highly shareable and increase a business’s content exposure. According to marketing research, infographics receive about three times more likes and shares on social media than any other type of content.
Infographics are also incredibly versatile and can help businesses get more mileage out of their content. They can be used in a monthly newsletter, incorporated in a press release, posted on social media, used in blog posts, and even have their own page on a website.
Enhance Brand Awareness
Infographics provide a great opportunity to enhance brand awareness by incorporating brand font, brand logos, brand colors, and other brand-specific information. When a business’s target consumer encounters these infographics, they become more aware of that brand and associate that brand with its industry. These branding efforts also help differentiate a business’s infographics from other infographics.
Build Brand Credibility
Creating infographics with authoritative, industry-specific information naturally positions a business as a leader and expert in their field. When seen as a trustworthy source of information, businesses also position their products or services as worthy of consumer trust.
Boost SEO
Finally, infographics are great for building stronger SEO. As more people share content (e.g. an infographic) that is linked back to your website, you will build backlinks and generate website traffic, both of which increase importance in search engine rankings.
Types of Infographics
Although infographics share basic elements—images and written text— there are many different kinds of infographics that are more effective than others for certain data sets.
Informational Infographic: Informational infographics usually communicate a new or specialized topic. They use descriptive headers and illustrative icons to help communicate each point clearly.
Visual Infographic: A visual infographic is a piece of text woven together with images. It is often used to make a plain article or story more engaging and interesting to the reader.
List-based Infographic: List-based infographics share collections of tips, lists of resources, and more listed information in a straightforward, numbered fashion.
How-To Infographic: A how-to infographic provides step-by-step instructions to outline a process and make it easier to understand. For example, businesses can use how-to infographics to outline the steps needed to effectively use their products or services.
Map Infographic: This is a geographic infographic that presents location-based data. Map infographics can be used to present and share data trends based on geographic locations.
Comparison Infographic: A comparison infographic compares two ideas, concepts, or objects. It can highlight the differences or highlight the similarities between two things. It could also prove that one option is better or worse than the other.
Data Visualization: Data visualization is a type of statistical infographic. It illustrates complex data through charts, graphs, and design. This type of infographic makes facts and statistics easier to absorb and more interesting to read. For example, data visualizations could be used to communicate survey results or present data to back up an argument.
Flowchart Infographic: Flowchart infographics simplify and break down complex processes into easy-to-understand steps. Businesses could use flowchart infographics to explain industry-specific practices or complex processes.
Timeline Infographic: Timeline infographics tell a chronological story. It can show how something has changed over time, show how one thing leads to another, and highlight important dates or the history of something.
Animated Infographics: If your audience enjoys innovative creative content, then they will love animated infographics. Animated infographics incorporate micro-animations in an infographic design to add an element of unexpected liveliness to the imagery.
Does your business want to drive more quality traffic and engagement across platforms? Contact Sun Sign Designs to discuss custom infographics and content tools that will energize your marketing strategy.


Leave a Reply
Want to join the discussion?Feel free to contribute!